![]()
The Bull Turns 5 (Risk Management Mathematics)
By now you have probably heard quite a bit in the media about March 9, 2014 being the 5 year anniversary of the bull market in U.S. stocks that started in March of 2009. The stock market has certainly experienced a long and powerful move upward over that time frame, with the most recent calendar year of 2013 being especially strong. It is almost hard to remember the near universal panic in the markets of March 2009, when the S&P 500 was already down in value -25% for the year and with several large financial institutions either already out of business or close to being so.
But the lesson that is largely going untold about this period is that results for most investors during the full 7 year market cycle were largely dependent on what they did during the 18 month bear market before the bull started. For it is usually the minimization of losses, rather than the maximization of gains, that determines results over a long time period. And the most recent bear and bull market cycle gives us an ideal example of how the Math of Risk Management works.
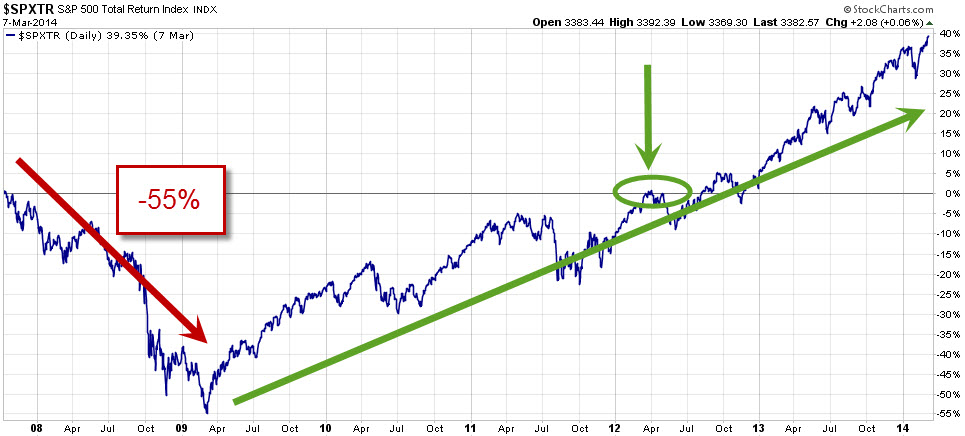
In the first chart below, you can see that an investor allocated only to the S&P 500 experienced a (-55%) drawdown from October 2007 until March 2009. From that point, the investor needed a +122% gain just to get back to even, and the green circle shows that this took place around April of 2012. So the math summary is that a 55% loss takes a 122% gain to recover (and usually a long time).
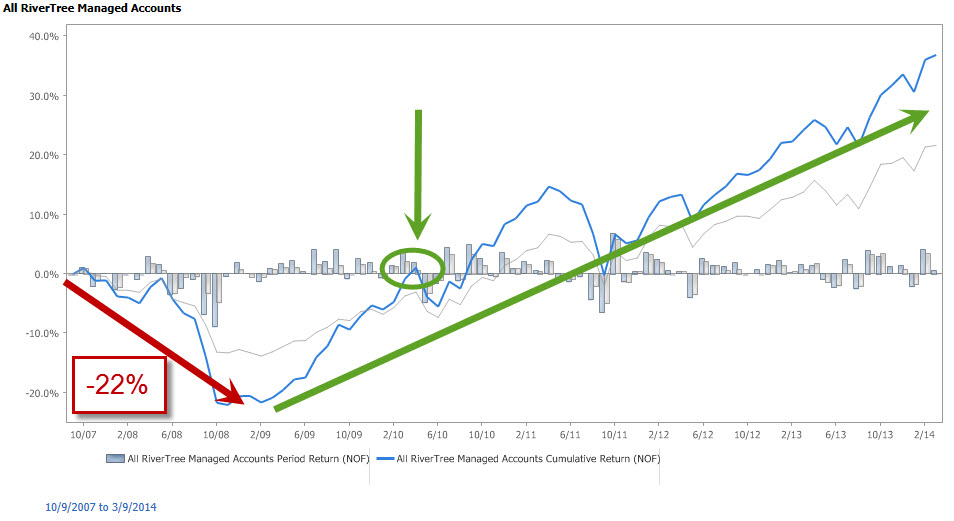
In the second chart below, you see a different investor who through diversification and active management experienced a (-22%) drawdown from October 2007 to March 2009. From that higher water mark, this investor needed only a +28% gain to return to even, and the green circle shows this taking place around April of 2010, a full two years before the first example. The math summary here is that a 22% loss takes a 28% gain to recover (and often leads to more sleep at night).
Many different types of investors exist in the marketplace and they all have a wide variety of appetites for risk and return, but there are many investors who would have preferred the path of the second chart below over the first. And as you may have noticed, the second chart below is the actual, aggregated returns of all RiverTree client accounts under active management over this time frame below. Our diversified approach and active management delivered a smaller drawdown and a faster recovery to positive territory during this market cycle than the overall equity markets. Of course, past results are never a promise of future returns, and no one knows for sure where global markets are headed from current levels, but over the time frame below, our process added significant value to the results of our clients during that challenging time.
The legendary investor Benjamin Graham said it best, which is why he is quoted right on the front page of our website - "The essence of investment management is the management of risks, not the management of returns. Well-managed portfolios start with this precept."
Click on the below image to see the larger version:
Click on the below image to see the larger version:
Need some advice?
We're here to help. Get in touch with us and we'll do our best to guide you in the right direction.