![]()
The Math of a Correction
With the increase in stock market volatility over the last few weeks, we thought it prudent to write a brief update for our clients. If you have not watched our 20 minute client video update from last week that covers this issue in more depth, please do so or let us know and we can resend the link to you. First let us state that we don't typically use the word 'correction', but that is what the financial media continues to be stuck on, so we will allow it in our title for today. Our preferred description of the current stock market action is 'drawdown', which simply describes a move down from a higher level, while 'correction' implies a move from 'incorrect' prices to 'correct' prices, which really makes no sense.
Regardless, the two important points for today are: 1. The current drawdown is both normal, expected, and healthy and 2. Our client allocations are only partially invested in the U.S. stock market, and several of our other asset classes and segments continue to hold up well.
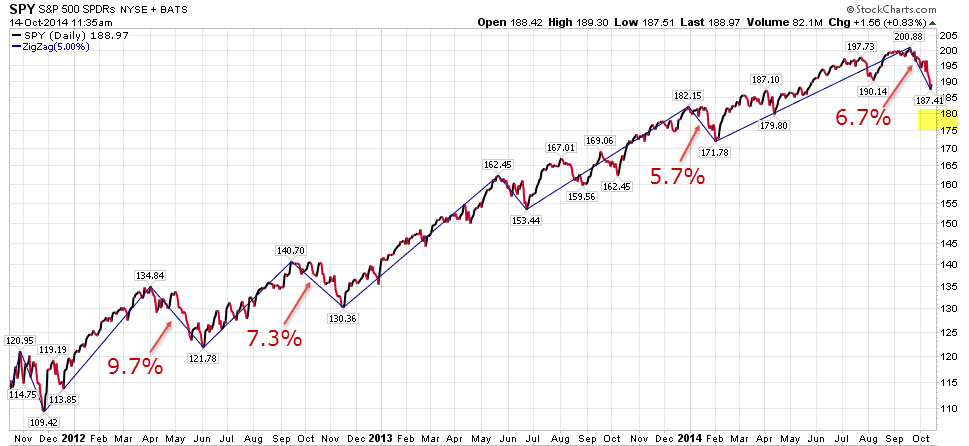
The first graph below shows a 3 year chart of the SPY security which tracks the S&P 500 index of large U.S. stocks. The current drawdown has produced a move of -6.7% since the new high mark hit less than one month ago. You can also see the drawdowns of -5.7% earlier in 2014 as well as the -7.3% and -9.7% downward moves in 2012, which make the current move look very normal at this point. Also, the small yellow highlight box on the far right shows the range where a 10-12% drawdown would take the price on this particular chart.
We have been saying all year that historical statistics showed 2014 had a 100% chance of a drawdown of at least 5% and an 80% chance of a drawdown of 10-12%. The smaller move down already took place in the first quarter of the year, and the likelihood is high that we are in the middle of the 10-12% move down now. We have also said all year that the larger drawdown would be very normal and healthy at this point in the current bull market in equities, and that it would probably set things up for the next significant uptrend, as the current bull likely has years left to run.
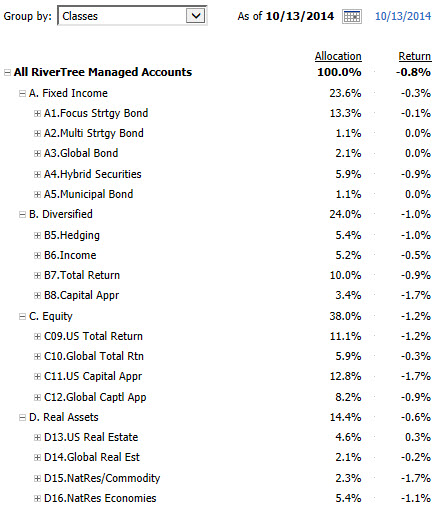
The second graph below shows the current broad allocation of RiverTree client accounts. You can see that only a portion of our clients assets are allocated directly to equities, and overall on a day like yesterday which had the S&P 500 down -1.65% on the day, 14 out of our 17 segments outperformed the S&P 500. Remember, it is not the performance of the S&P 500 or Dow Jones Averages that matter, it is the performance of the broadly diversified group of funds that are actually in your portfolios that matter. The current situation certainly warrants heightened vigilance, but so far it is falling within normal expectations and statistics.
Hopefully this brings some perspective to the recent investment activity, and as always, please do not hesitate to contact us if you wish to discuss anything further.
Need some advice?
We're here to help. Get in touch with us and we'll do our best to guide you in the right direction.