![]()
Current Stats on U.S. Market
Please take the time to read this most recent update on current global investment market conditions, focusing on the U.S. stock market.
In just the last week, the U.S. stock market has changed from a sideways and calm trajectory to a almost straight downward move with a huge increase in volatility. We can discuss some other time the reasons for the action of the last four trading days, but it will be hard to find a solid fundamental or economic reason for a move like we have seen that was not already known a week ago.
Regardless of the why, the most important actions now are to analyze what has happened and decide what, if anything, to do in response.
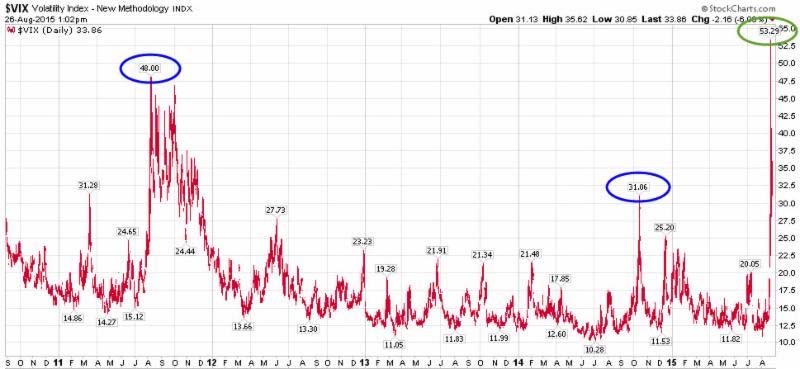
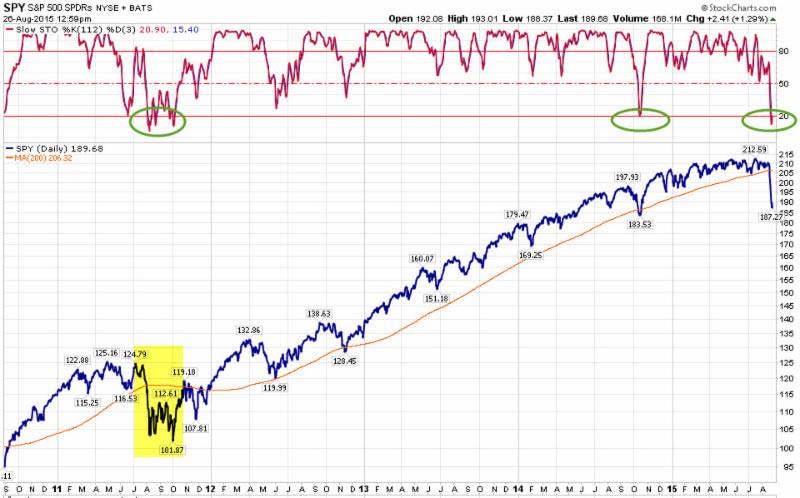
Below are two graphs that summarize the extreme statistical readings we are now experiencing in the domestic stock market, as represented here by the S&P 500 Index.
The first graph shows a measure of volatility known as the VIX, and on the far right you can see the magnitude of the recent spike (green circle). Not only is the rise in volatility extreme over this 5 year time span, but it clearly exceeds the volatility spikes seen during stock market lows in 2014 and 2011 (blue circles).
The second graph below shows the 5 year price changes in SPY - a fund tracking the S&P 500 index. On the far right you can see that the recent selloff has taken this price right back to the lows hit in October of 2014. The top panel above the chart shows a measure of buying and selling pressure in this security. The green circles show where the selling pressure has now hit extreme levels that were last reached at the market lows of October 2014 and August 2011. Also shown in the yellow highlight on this graph is the selloff of August-October of 2011. This analogy is interesting because it also seemed to come out of nowhere from a sideways trending market, and it had a similar initial move down in speed and magnitude. Please make note that the 2011 drawdown took a few months of back and forth movement to get fully absorbed, then was able to continue an upward path. It would not be unusual for some type of similar, multi-month absorption process to be necessary this time as well if the stock market is to resume an upward trajectory.
Need some advice?
We're here to help. Get in touch with us and we'll do our best to guide you in the right direction.