![]()
Government Shutdown Market Results are In!
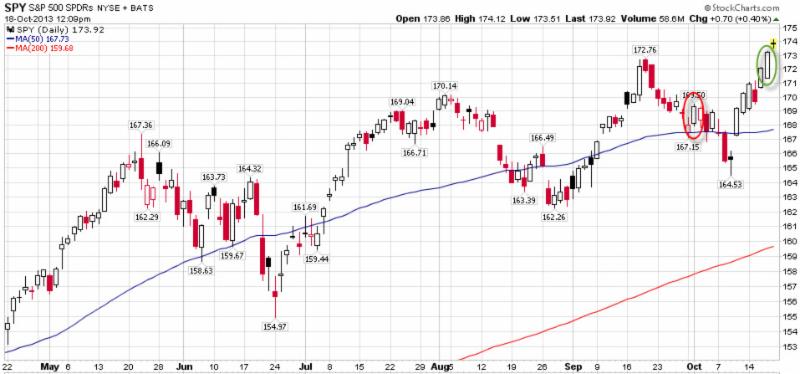
It’s over! As we wrote to you in September, no U.S. Government ‘shutdown’ in recent history has lasted more than 21 days, and this one fell right in line, ending at day 16. We also shared with you that most shutdowns tend to be minor events in the investment markets, and this one was even weaker than most. As you can see below on the chart of the S&P 500 tracking ETF, the red circle shows the beginning of the shutdown period on October 1 and the green circle shows the end, clearly higher than when it started. Overall the S&P 500 gained more than +3% during this period. In fact, if you just back up and look at this six month chart pattern as a whole, you would not even know that anything special took place in October.
Remember this the next time shutdown hysteria shows up in the media, which could be as soon as a few months from now!
Click on the below image to see the larger version:
Need some advice?
We're here to help. Get in touch with us and we'll do our best to guide you in the right direction.