![]()
Happy Anniversary? Not Quite
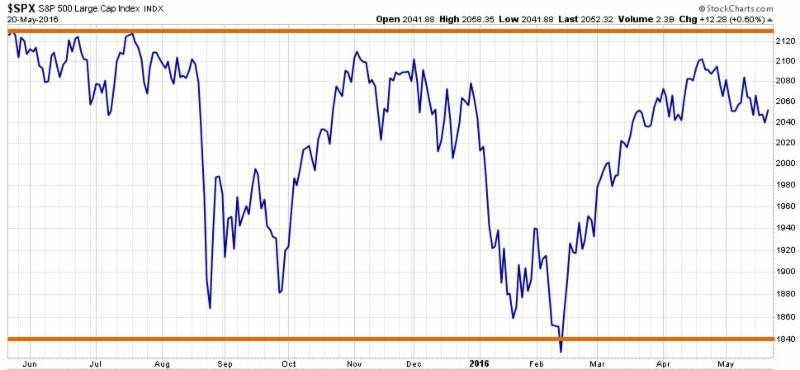
This past week marked the one-year anniversary of the most recent all time high levels in the U.S. stock market's major averages. It was around May 20th, 2015 when the records were hit and the equity markets seemed to be humming along en route to a nice return for the calendar year of 2015. As we now know, the next 12 months, however, would be the opposite of the continuation of a smooth ride.
Instead, you can see clearly in the first chart below that the S&P 500 Index (blue line) whipsawed over the next year, experiencing two sharp sell-offs and two sharp rallies. The result of this action was the establishment of a large trading range (orange lines), and negative return for that one year period of time. Results for other stock segments such as small companies and international companies were even worse. Many of our research sources have stated that this last 20 months has been the toughest investment environment they have seen in decades.
The good news is that this type of trading range is very normal after the large run-up in stocks that occurred from 2009-2015. In fact, history shows that long- running bull markets in the past often include long periods of sideways trading range action during the period. Often these pauses were ultimately what helped the bull market continue upward after the trading range ended. Examples of these periods occurred in 1951, 1959, and 1987, and lasted for 25 months, 39 months, and 38 months respectively. The current trading range is approximately 20 months old to date.
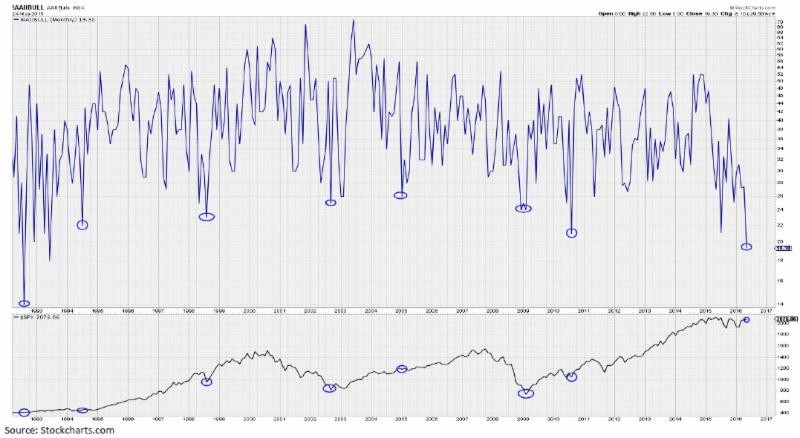
The other positive event occurring in the equity markets is the huge amount of negative sentiment currently present in the minds of investors. As you may recall from past updates, when investors 'feel' pessimistic about the outlook for stocks, that typically does not coincide with market tops. In fact, the graphic below shows one measure of investor sentiment all the way back to 1992. The circles in the top half of the chart show when investor sentiment reached extremely low levels, and the current level is the lowest since 1993 (even lower than the bear market bottoms of 2002 and 2009). The probabilities are very low of a major stock market sell-off from readings this low, and over time these levels have actually marked significant market bottoms, as indicated by the circles in the bottom half of the chart.
Of course, anything can happen in the investment world and no predictions are being made here, but this combination of a long trading range and very negative investor sentiment does raise the odds that an upside surprise could take place at some point.
Please enjoy your Memorial Holiday weekend, and please help us in extending a huge 'THANK YOU' to all military personnel who have served our country so bravely and selflessly. We would not be where we are today without you!
Happy Memorial Day!
Need some advice?
We're here to help. Get in touch with us and we'll do our best to guide you in the right direction.