![]()
Markets Pause After Election Rally
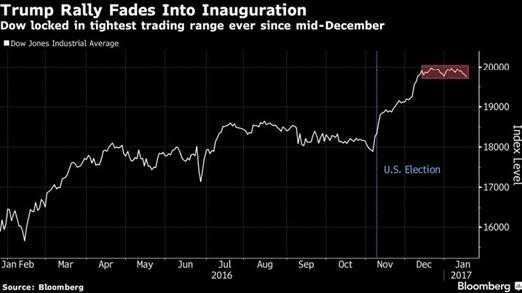
A new Presidential Era began last Friday with Donald Trump's inauguration, and the stock market reaction was far more restrained than its response to his election. For weeks after the presidential election, we saw equity markets defy expectations and post significant gains. In fact, the Dow grew by over 1,500 points between November 8 and December 12.
In the four days of trading last week, major U.S. stock indexes continued the sideways performance we've seen since December. For the week, the S&P 500 was down 0.15%, the Dow lost 0.29%, and the U.S. Corporate Bond Index gave back 0.39%. International stocks also declined by 0.48%.
Despite these weekly losses, Friday's market performance marked one milestone not seen since John F. Kennedy's election: index gains on inauguration day. Nonetheless, we still see a market that has been in a holding pattern for weeks. The S&P 500 has barely moved since the day before the Fed raised rates on December 14. And if you analyze this graph of the Dow's performance, you see a similar scenario. The index grew sharply after the election, but the red box shows performance pausing since December.
Why has the Trump Rally paused?
The markets are incredibly complex and multifaceted, so one answer cannot fully explain their performance. However, after rallying in anticipation of Trump's promises for lower taxes, decreased regulation, and increased infrastructure spending, investors are now waiting to see which policies will come to fruition.
Additionally, it is normal and healthy for a market to pause for a while after a significant buying stampede. As long as the pause (or even a modest sell off) stays contained, it can potentially rebuild enough energy for a next leg upwards. However, markets can do anything and no one knows for sure what policy changes or political developments lay ahead, so we must continue to look closely at fundamental and technical measurements to see beyond the headlines and find a clearer view of where the U.S. economy stands today.
What are the fundamentals telling us?
During the current corporate earnings season, 63 companies have reported their fourth-quarter results so far. Of these companies, 63% beat earnings-per- share estimates and 46% exceeded their sales estimates.
Last week, we also saw:
- The Consumer Price Index increase by 0.3% for December
- Industrial production increase by 0.8% for December, erasing its November decline
- Housing starts rebound by 11.3% for December after dropping 39.4% in November
This week, three factors will give us a deeper view of economic performance: 1) fourth-quarter GDP reports, 2) consumer sentiment data, and 3) home sales figures. By analyzing data rather than focusing on hype and predictions, we can make decisions based on statistics instead of emotion.
What should you focus on?
No matter your political perspectives, moments of change can elicit emotional reactions from even the most rational investors. As always, emotions have no place in investing.
Consider this: After former President Barack Obama's election in 2008, the S&P 500 dropped 15.5% by inauguration day, as his transition period coincided with the deepening financial crisis. Investors who allowed emotions to take over at that point and exited the equity markets could have missed the S&P 500's significant growth while Obama was in office.
Now is the time to continue focusing on your unique risk and return preferences, your long-term goals, and the economic fundamentals, not the breaking political news of the day.
Need some advice?
We're here to help. Get in touch with us and we'll do our best to guide you in the right direction.